Redefining Performance Indicators in Cycling: Beyond FTP
Introduction
With the rise of trainer applications like Zwift, WahooX, and TrainerRoad, there has been an emphasis on power metrics, particularly Functional Threshold Power (FTP), to classify cyclists into categories and prescribe interval training durations and intensities. For the average cyclist, concepts like FTP and other metrics such as MAP (Maximal Aerobic Power), Heart Rate Threshold, and Maximal Heart Rate can be confusing. This confusion can lead to many cyclists abandoning science-based training methods in favor of more holistic approaches, susceptible to misinformation and pseudo-scientific beliefs. Others may blindly rely on their FTP for training without considering the specific nuances of their training needs, resulting in sub-optimal outcomes.
It’s important to note that not all platforms are the same. While Zwift relies solely on FTP to prescribe training, WahooX (formerly known as The Sufferfest) uses a combination of maximal 1-minute power (Anaerobic Capacity or AC), 5-minute power (MAP), and 20-minute power (FTP) to address this issue. However, regardless of the approach, it’s crucial to ensure that FTP can be measured reliably and is a relevant metric. As we will explore in this article, both points are only partially valid.
In this brief article, based on the current state of the scientific literature, we will first examine the physiological metrics commonly employed in sports science and explore the methods used to measure them, their limitations, and their relevance. Then, we will delve into the history of Functional Threshold Power (FTP) to understand how it became the predominant metric and why its time may end.
Finally, we will introduce a new contender, the Critical Power (CP), believed to be a better predictor of performance, and the Capacity above Critical Power (W’), considered a superior indicator for prescribing intensity and interval duration.
This article is grounded in the current state of the scientific literature, and several reviews in our sources delve deeper into the subjects we will address in this article.
Physiological Markers
Lactate [6][3][2]
One of the first myths that needs to be debunked in endurance training sports is the infamous “lactic acid,” which is often singled out to negatively impact athletic performances and cause suffering. This topic is well-known to avid sports enthusiasts who watch events on television, where commentators and former athletes frequently refer to “lactic acid.” However, these “professionals” have overlooked the scientific literature, which has been addressing this issue for more than 30 years.
It has been well-established for a long time that muscles do not produce lactic acid but rather lactate. Furthermore, lactate is not a waste product of muscle activity but a fast and efficient energy source. Another misconception is that lactate production leads to metabolic acidosis, which in turn causes muscular fatigue. The origin of metabolic acidosis is still under investigation. Still, it is not directly related to lactate production. Surprisingly, metabolic acidosis may have limited effects on muscle fatigue, and some studies have demonstrated beneficial effects. Contrary to common beliefs, studies have shown that well-trained individuals can convert lactate from non-carbohydrate sources into glucose more effectively than non-trained individuals, highlighting the positive influence of lactate on athletic performance.
The significance of blood lactate concentration was discovered when it was monitored during monotonous increasing physical exercise. The most common representation based on blood lactate concentration is a three-zone model, where blood lactate remains constant until the First Lactate Threshold (LT1). Beyond this point, blood lactate concentration increases with intensity until the Second Lactate Threshold (LT2), coinciding with the Maximal Lactate Steady State (MLSS, the highest workload that can be sustained without ongoing lactate accumulation), depending on how LT2 is determined, where blood lactate thresholds increase dramatically. Coaches often use this three-zone model to prescribe training intensity: low intensity below LT1 and high intensity above LT2.
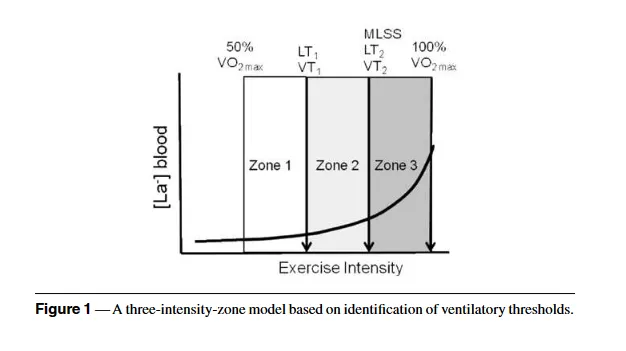
There is some controversy over how to determine these thresholds. Some advocate for fixed concentrations, such as LT1 for a workload producing 2 mmol/L (sometimes 1 mmol/L) and LT2 at 4 mmol/L (or when lactate blood concentration varies less than 1 mmol/L for the last 20 minutes of constant-intensity exercise). Others prefer analyzing the intensity versus the lactate blood concentration curve during increasing physical activity. Most commercial endurance testing firms opt for the fixed concentration protocol, even though strong scientific evidence indicates this approach’s unreliability.
The reliability of lactate testing is debated and is primarily limited by the measurement protocol and device accuracy. The literature shows that some blood lactate readers may not be sensitive enough to record meaningful changes, and factors such as setup, protocol, and warm-up can impact test results. More than 30 tests are reported to compute lactate parameters with minor variations in protocol and lactate parameter definition, and determining the Lactate Thresholds can vary by up to 30% depending on the protocol used. However, these limitations can be mitigated by better standardization of equipment and testing protocols. Additionally, LT2 is sport-specific, making it more challenging to use in sports like triathlon, where there is a need to perform three complete and separate lactate tests.
While it is clear that measuring lactate requires specialized devices and protocols, the question remains: Is the inconvenience of performing such tests justified? Blood lactate concentration was shown to be predictive of endurance performance, not by the value of the concentration itself but by the workload (in cycling, the power) at that concentration. For example, the workload at LT2 is higher in professional cyclists than in average-trained cyclists. Another important aspect of physiological metrics is their ability to prescribe training. Several sessions with bouts of high intensity have been shown to boost athletic performance. Still, the intensity and duration of these bouts need to be optimized for the specificity of the athlete. Regarding lactate parameters, the percentage of LT1 and LT2 to normalize exercise intensity has been shown to be reliable, making it a valuable tool for athletes.
The workload at lactate thresholds predicts endurance performance and provides valuable information for prescribing intensity intervals. However, the need for invasive lab tests and the variability in measurements and testing procedures can be limiting factors. This is likely why, in the field, only top elite athletes use it as a training tool.
VO2 and Heart Rate [2] [5]
Heart rate and oxygen consumption are among the oldest observed physiological markers in sports. Heart rate monitors are the most commonly used metrics in amateur sports, and many intensity recommendations are based on percentages of a given heart rate.
(Un)surprisingly, maximal heart rate was shown to be a poor predictor of performance, and exercise intensity based on percentages of maximal heart rate is inefficient. Therefore, heart rate training offers no significant advantages. However, monitoring resting heart rate and heart rate during specific workloads can be an effective strategy for tracking athlete fatigue, as a higher resting heart rate can be a sign of illness. A lower-than-usual heart rate for a specific workload can indicate fatigue.
VO2 max, defined as the maximum rate of oxygen consumption attainable during physical exertion, was shown to have limited predictive value for performance and is inefficient for normalizing intensity zones for interval training or monitoring performance improvements. Notably, a reasonably high VO2 max is generally necessary to compete at the top elite level, and a reduction in VO2 max can serve as a strong marker of fatigue, making it useful for screening or diagnostic purposes.
Even though VO2 max and maximal heart rate are considered the gold standard in amateur athletes, their advantages are almost non-existent because they are not strongly correlated with performance and are unsuitable for normalizing training zone intensities. We will not detail the pitfalls and controversies in measuring these values as there is little to gain from using them for training.
Critical Power [1] [2] [4] [5]
With the development of affordable power meters, what is known as power profiling, i.e., the maximal power output that can be produced for a given time to task failure (TTF), can now be applied outside the lab by coaches and athletes. The hyperbolic relationship between exercise intensity and duration was first established in 1925 and used successfully in cycling in 1981, so it is not a “recent” concept. Stay with me for this section, as it’s a bit more complex than the preceding ones because Critical Power (CP) is the metric that offers the most advantages to date, and it will be silly to pass by.
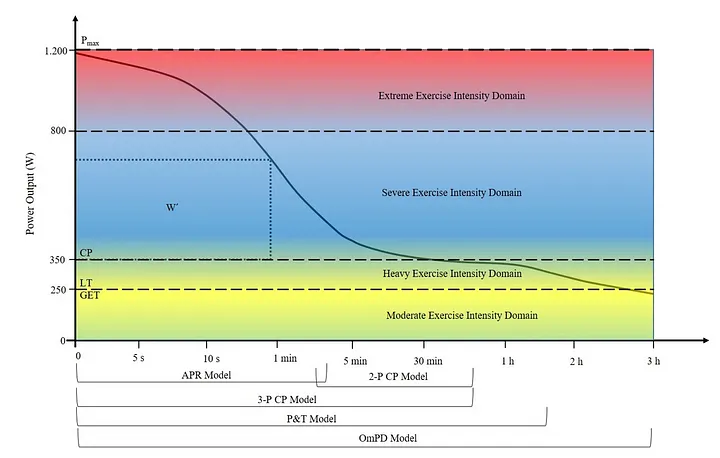
Critical Power (CP) models aim to mathematically describe the complex physiological activities inside the body during exercise and produce a power-duration relationship with predictive and prescribing value. In these models, Critical Power (CP) is defined as the power that can be sustained in a steady-state effort without fatigue, and W’ represents the amount of work that can be done during exercise above CP. We can see this as a reserve that depletes when power exceeds CP and regenerates when power falls below CP.
Physiologically, by monitoring fatigue signs, we can determine three areas: The moderate exercise intensity domain (below LT1) is where fatigue develops slowly and resides in the central nervous system. The heavy exercise intensity domain (between LT1 and CP) is where central and muscle fatigue is observed. The severe exercise intensity domain (above CP) is where there are derangements of muscle metabolic homeostasis and consequent peripheral fatigue.
Several models are available to compute CP and W’, and their validity is restricted to specific intensity domains. Therefore, practitioners should select the one that closely matches the demands of their given discipline or training to perform a power-duration relationship analysis.
We won’t delve deeper into these models for those who may fear math. Instead, let’s explore why CP and W’ are beneficial. First and foremost, CP has been shown to be a strong predictor of cycling performance, and CP and W’ are accurate prescribers to normalize intensity intervals. Real-time computation of W’ can especially assist in constructing intervals tailored to the specificity of an athlete in the severe intensity domain. It has been demonstrated that the regeneration of W’ is athlete-dependent. Still, at this time, a successful model has yet to be created to describe this phenomenon. Creating such a model could significantly impact training and races, where attack intensity, duration, and frequency could be perfectly timed using W’.
It’s worth noting that GoldenCheetah, the open-source analysis and training software, already incorporates CP and W’, which can be viewed live during a training session.
As always, CP and W’ metrics have several limitations that may constrain their adoption by the general population. First, the current most reliable test consists of three to five trials of maximal efforts lasting between 2 and 15 minutes (with one trial per day) to determine the time-power relationship. This method is not well-suited for athletes due to the training disturbance it creates. A second approach is the 3-minute all-out test, where athletes pedal as fast as possible during the trial without pacing. A good correlation between this test and the previous one is found, but there is a tendency to overestimate CP and W’ for well-trained athletes. Another point to consider is that this all-out test results in many failed attempts where the candidate cannot sustain the effort for the entire 3 minutes due to the psychological and physiological toughness of the effort.
CP and W’ appear to be perfect candidates for predicting performance and prescribing intensity. CP marks a measurable physiological boundary using a simple but physically demanding protocol. Adding W’ allows training to be executed more precisely than with CP alone. Future research is needed to study the complex regeneration of W’ so that CP and W’ can effectively predict race strategy.
Attentive readers will notice that we didn’t discuss FTP in this section. This omission is intentional because FTP doesn’t correspond to a physiological marker. It was created as a surrogate for MLSS, representing the maximal power that can be sustained for 60 minutes. In the next section, we will delve into this concept, its reliability, and how it relates to all the concepts we’ve described. More importantly, we will explore why this current gold standard alone is inadequate for prescribing training.
The Functional Threshold Power [5] [3]
The functional threshold power (FTP) was defined by Allen and Coggan in 2012 as the maximal mean power that can be produced during a quasi-steady-state effort of 60 minutes. It was arbitrarily designed as a practical equivalent to the MLSS (Maximal Lactate Steady State).
FTP vs FTP
Initially, determining FTP involved a comprehensive protocol that included a 45-minute warm-up with several efforts followed by a maximal effort of 20 minutes. FTP is calculated as 95% of the mean power produced during the 20-minute effort. This test has been reported to be highly reliable and reproducible among trained athletes, but several factors can affect the test results.
The warm-up routine has been shown to impact the power produced during the 20-minute test. The pacing strategy also influences the test results, requiring a certain level of ‘familiarization’ with the test before obtaining consistent and reproducible results. Additionally, predicting FTP based on 95% of 20 minutes of power output instead of an actual 60-minute power output seems to have limited accuracy, with good validity among well-trained athletes but a strong dependence on the athlete’s training status and level.
Functional threshold power is easily determined through relatively inexpensive tests, contributing to its popularity on platforms like Zwift. Whether the arbitrarily set FTP truly represents a physiological boundary and possesses predictive and prescriptive capabilities remains to be seen.
FTP and blood lactate
FTP was arbitrarily established as a surrogate for the MLSS (Maximal Lactate Steady State), and several studies have investigated the relationship between FTP and blood lactate parameters. These studies indicate that FTP should not be used interchangeably with lactate parameters. More importantly, FTP should not be considered a valid substitute for the MLSS, which raises questions about the physiological justification of FTP.
FTP and CP
Some readers may be confused about the definitions of FTP and CP, which seem similar. To clarify, CP (Critical Power) is the power output that can be sustained without fatigue. At the same time, FTP (Functional Threshold Power) represents the mean power output during a maximal steady-state effort lasting 60 minutes. In practice, an athlete can typically maintain their CP for 40 to 60 minutes, making it appear similar to the definition of FTP.
However, it’s important to note that CP is grounded in physiology and serves as the demarcation point between the heavy and severe intensity domains. Research has shown that CP and FTP should not be used interchangeably. While these two values have a strong correlation, a large Limit of Agreement (LoA) suggests this correlation may be coincidental.
Another important parameter in the Critical Power model is W’, which represents the work that can be done during exercise above the Critical Power (CP). Research has shown that W’ is not correlated with how much work can be done above FTP.
Overall, CP has been demonstrated as a better indicator for assessing an athlete’s performance level than FTP. Additionally, CR and W’ are better suited for prescribing the intensity and duration of exercises than the FTP alone, challenging the legitimacy of the FTP as the gold standard metric.
FTP and performance prediction
Online competitive platforms like Zwift use relative functional threshold power (FTP divided by the athlete’s weight) to classify athletes. However, it has been demonstrated that relative FTP is a significant performance indicator only in mountain bike races, and data still needs to be provided for other cycling disciplines. Nevertheless, it was shown that a sufficiently high relative FTP is required to perform at an elite level, which could make it a helpful screening parameter.
However, it should be taken with a grain of salt as a performance predictor in varied terrain events like mass start cycling races. In contrast, absolute FTP did not predict race performance except for time trials. These findings call into question the practice of categorizing athletes based solely on FTP as a surrogate for their physical performance.
Conclusion
Functional Threshold Power (FTP) has become a gold standard metric due to its relative reliability, ease of implementation, and simplicity. Some limitations associated with the testing protocol can be mitigated through standardization, and FTP can provide valuable data for tracking performance. However, FTP lacks physiological validation and demonstrates severe limitations in predicting performance and prescribing training.
Furthermore, there are uncertainties in the definitions and testing methods for blood lactate parameters, making it challenging to compare and use the results and predictions derived from these metrics. The emerging model as a new gold standard for predicting the Maximal Metabolic Steady State and athlete performance seems to be Critical Power, which can be combined with W’ (the amount of work that can be done during exercise above Critical Power) to prescribe and optimize the duration and intensity of training exercises. Further research will likely uncover and model the regeneration of W’, opening new possibilities in training and race strategy.
References
- [1] A. Chorley & K. L. Lamb: The application of critical power, the work capacity above critical power (w’), and its reconstitution: a narrative review of current evidence and implications for cycling training prescription. Sports, 8(9):123, 2020.
- [2] E. W. Faria, D. L. Parker & I. E. Faria: The science of cycling: physiology and training — part 1. Sports Medicine, 35:285–312, 2005.
- [3] M. M. Hall, S. Rajasekaran, T. W. Thomsen & A. R. Peterson: Lactate: friend or foe. PM&R, 8(3):S8–S15, 2016.
- [4] P. Leo, J. Spragg, T. Podlogar, J. S. Lawley & I. Mujika: Power profiling and the power-duration relationship in cycling: a narrative review. European Journal of Applied Physiology, pp. 1–16, 2022.
- [5] J. Mackey & K. Horner: What is known about the FTP20 test related to cycling? A scoping review. Journal of Sports Sciences, 39(23):2735–2745, 2021.
- [6] S. Seiler: What is best practice for training intensity and duration distribution in endurance athletes? International Journal of Sports Physiology and Performance, 5(3):276–291, 2010.