Smartphone-Based Heart Rate Monitoring: Preprocessing and Analysis of PPG Signals
Introduction
In a previous post, we explored the calculation of heart rate and heart rate variability parameters using Photoplethysmogram (PPG) signals and discussed recording PPG signals through a smartphone’s camera. This post will delve into an existing electronic component designed for recording PPG signals and provide a comprehensive guide on effectively utilizing it.
Disclaimer
In this post, we will be working with the HW-827 components, originally designed by World Famous Electronics LLC and originated as a Kickstarter project in 2011. On their official website, it’s evident that running the basic example with an Arduino yielded a near-perfect PPG signal with minimal noise interference. While several replicas of these components can be found on e-commerce platforms like Amazon and AliExpress, offering cost-effective delivery options, it’s important to note that the build quality and performance of these copies may not match the original. Many hobbyists have encountered challenges with these replica components due to increased noise levels. However, this post will demonstrate techniques to effectively recover a high-quality PPG signal even when using these less-ideal replicas.
Setup
The electronic setup for this experiment is intentionally minimalistic. Three cables are soldered onto the HW-827 device:
- Vin is connected to the Arduino’s 5V.
- The ground is linked to the Arduino’s ground.
- The Signal wire is attached to the A0 analog pin on the Arduino board.
We then employ a straightforward Arduino sketch that reads the A0 pin’s values and transmits them via the serial connection for data collection.
The HW-827 sensor is securely fastened to the subject’s fingertip using a Velcro strap to ensure accurate recording. The subject must remain still during the recording to minimize motion artifacts. Additionally, the recording is conducted under natural ambient lighting conditions. The sensor’s values are recorded using the Linux “cat” command, and a timestamp for precise tracking and synchronization accompanies each data point.
Filtering
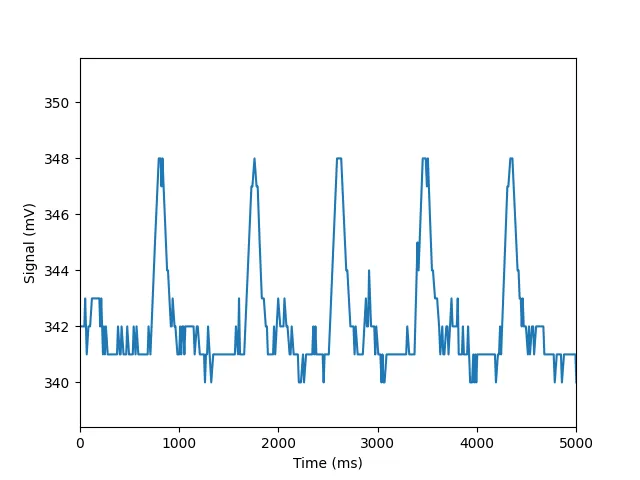
Figure 1 displays the unprocessed recorded signal, which exhibits a considerable noise level with low-amplitude variations within the signal range. In addition to noise, we can observe sampling steps, which makes it challenging to identify the distinctive features of the PPG signal, including the systolic and diastolic peaks and the dicrotic notch.
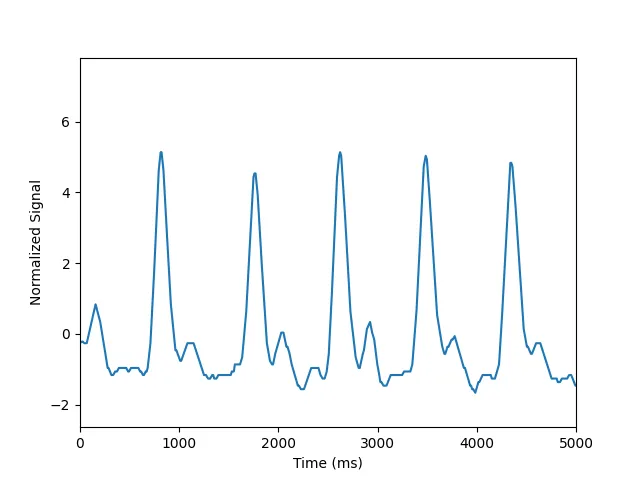
To enhance the quality of the signal, we take two key steps. First, we reduce the sampling and noise artifacts by applying a Wiener filter with a window size of 10. Subsequently, we detrend the signal by subtracting its mean value. As depicted in Figure 2, these operations result in a substantially improved signal representation, now exhibiting the characteristic shape of a PPG signal, making it easier to identify its essential features.
Analysis
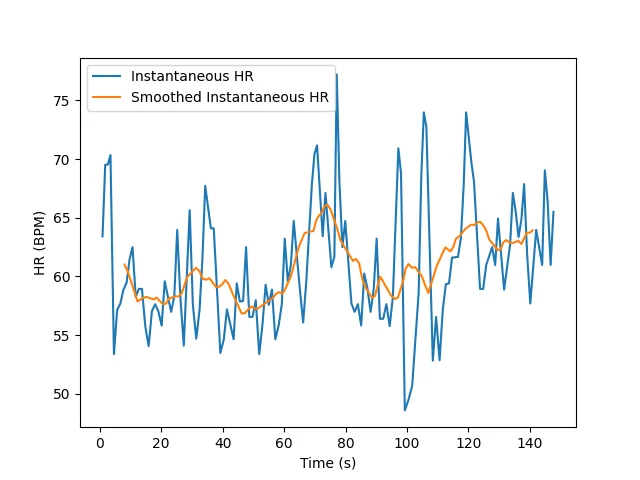
Now that the signal has been cleaned, we can proceed with peak detection to identify the diastolic peaks. The signal can also be resample using interpolation to get a better time resolution if necessary. The time intervals between consecutive diastolic peaks are referred to as RR intervals. To refine the data, we exclude RR intervals that deviate by more than three standard deviations (sigma) from the mean, resulting in the NN intervals.
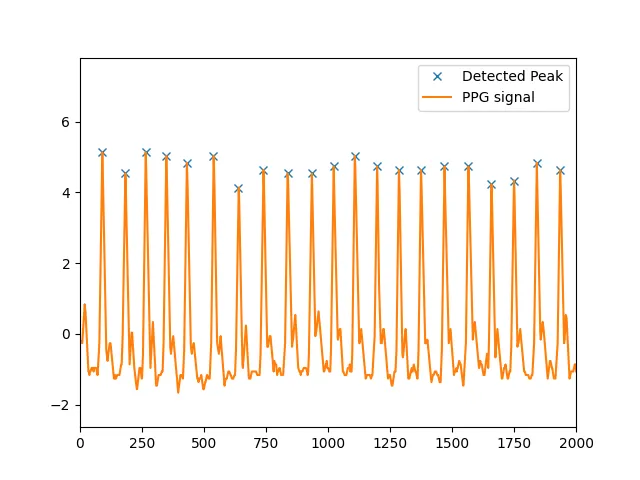
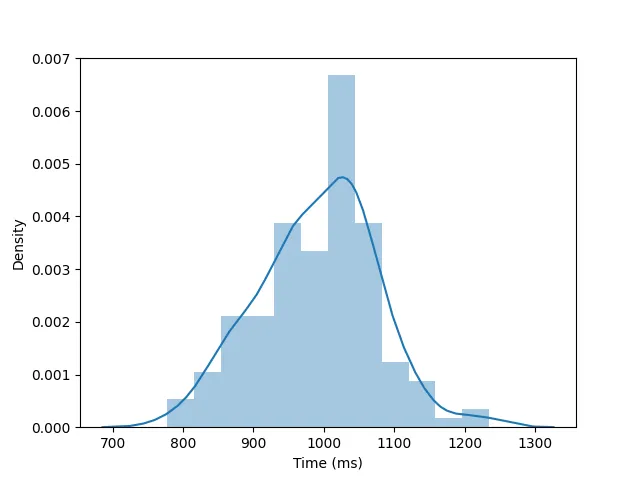
As usual, we can derive the Heart Rate (HR) and Heart Rate Variability (HRV) values from these NN intervals, as discussed in a previous post.
Comparison
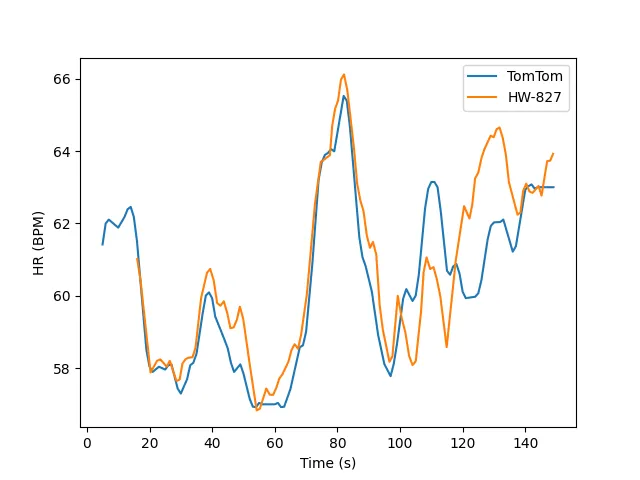
The subject was also equipped with a TomTom chest strap connected to a Wahoo bike computer during the recording. This was done to compare the results obtained from the HW-827 sensor. It’s worth noting that the chest strap recorded data at a frequency of 1 Hz only, whereas the PPG sensor operated at a higher frequency. The mean heart rate recorded by the HW-827 was 60.98 beats per minute, while the chest strap recorded an average heart rate of 60.28 beats per minute. To ensure a more comprehensive comparison, we utilized the NN intervals to compute a continuous heart rate and then compared it to the chest strap data. A rolling mean was applied to the continuous heart rate signal to align it with the 1 Hz chest strap signal. This comparison revealed strikingly similar trends and very close mean values. Given that we lack knowledge about the reliability of both the TomTom chest strap and the HW-827, it’s still safe to conclude that the two recordings are in good agreement.
Conclusion
The HW-827 is an affordable component readily available on numerous marketplaces. The reliability of this component largely hinges on the supplier’s quality. Still, our experimentation has shown that even with a less reliable unit, it is possible to attain a relatively high level of accuracy through straightforward signal processing techniques.