Open-Source PPG Heart Rate Monitoring: Empowering Users with Raw Data Access
Introduction
Continuous heart rate monitoring and heart rate variability are frequently integrated into wearable devices. However, comprehensive data analysis (and access to RAW data) is often restricted behind a subscription paywall, making it inaccessible to many users. In this article, we introduce an open-source HR tracking device that is affordable and straightforward to construct. This device enables continuous HR monitoring and grants users access to the raw data, empowering them for in-depth personal analysis.
Material
- MAX30100 pulse oximeter: 14 EUR.
- Arduino Gemma M0: 20 EUR.
- Electronic components for soldering.
- Long micro USB cable: 10 EUR.
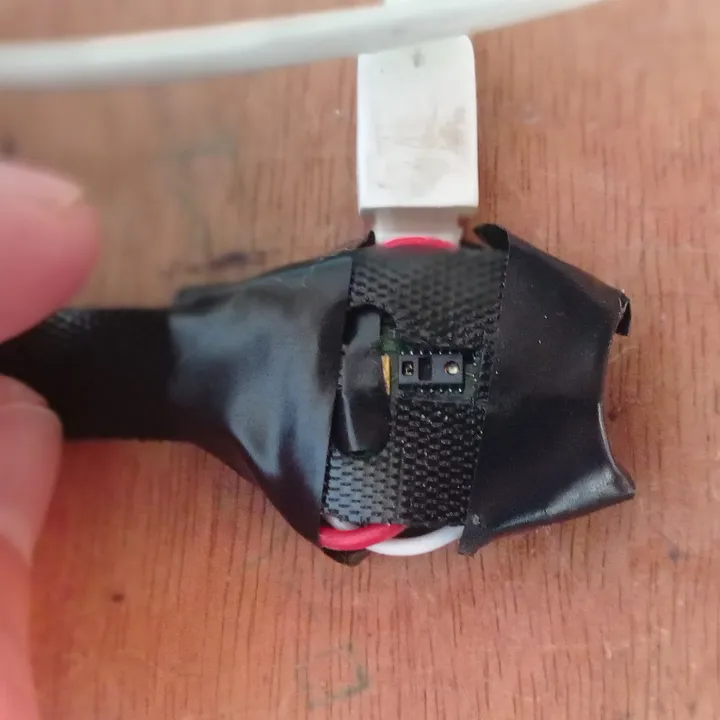
- A Velcro or adhesive strap to secure the device to a finger: 5 EUR.
MAX30100 preparation
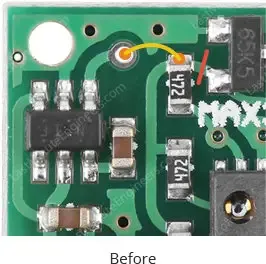
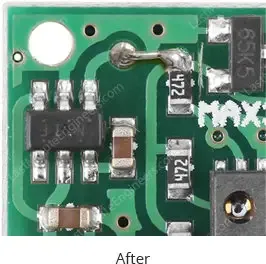
The MAX30100 can be easily interfaced with an Arduino, but there’s an essential consideration due to its dual supply voltage requirement: 1.8V for the IC and 3.3V for the RED and IR LEDs. Since Arduino typically operates at 5V logic levels, connecting the MAX30100 directly will not work, as the logic level is too low for the device, causing it to not function correctly on the I2C bus. One viable solution to this dilemma involves physically altering the circuit by cutting a trace and creating a new connection. For detailed instructions on achieving this, refer to this informative guide: https://lastminuteengineers.com/max30100-pulse-oximeter-heart-rate-sensor-arduino-tutorial/.
MAX30100 wiring
Connecting the MAX30100 to the Gemma M0 is a straightforward process, requiring only a few simple connections:
- Connect Vin from the MAX30100 to 3Vo on the Gemma M0.
- Link GND on the MAX30100 to the GND terminal of the Gemma M0.
- Attach SCL from the MAX30100 to the A1 pin on the Gemma M0.
- Connect SDA from the MAX30100 to the A2 pin on the Gemma M0.
These connections enable proper communication and power supply between the MAX30100 and the Gemma M0.
Gemma
We will employ a simple Arduino sketch to obtain RAW data from the MAX30100 chip. Initially, we must configure the Gemma by utilizing the Adafruit library. For detailed setup instructions, refer to the document accessible at https://www.mouser.com/pdfdocs/adafruit-gemma-m0.pdf#__WKANCHOR_3k. Subsequently, we should install the MAX30100 library for Arduino within the Arduino IDE:
- Sketch > Include Library > Manage Libraries…
- Install MAX30100lib Library by OXullo Intersecans.
Finally, in the Arduino IDE, select the appropriate port, choose the correct board (Gemma M0), and set the USB Stack to “tinyUSB” before uploading the sketch to the Gemma.
    #include 	<Wire.h>
    #include "MAX30100_PulseOximeter.h"
    #include "Adafruit_TinyUSB.h"
    // Create a MAX30100 object
    MAX30100 sensor;
    void setup() {
    Serial.begin(115200);
    Serial.print("Initializing MAX30100..");
    // Initialize sensor
    if (!sensor.begin()) {
    Serial.println("FAILED");
    for(;;);
    } else {
    Serial.println("SUCCESS");
    }
    // Configure sensor
    configureMax30100();
    }
    void loop() {
    uint16_t ir, red;
    sensor.update();
    while (sensor.getRawValues(&ir, &red)) {
    Serial.print(red);
    Serial.print(", ");
    Serial.println(ir);
    }
    }
    void configureMax30100() {
    sensor.setMode(MAX30100_MODE_SPO2_HR);
    sensor.setLedsCurrent(MAX30100_LED_CURR_27_1MA, MAX30100_LED_CURR_27_1MA);
    sensor.setLedsPulseWidth(MAX30100_SPC_PW_1600US_16BITS);
    sensor.setSamplingRate(MAX30100_SAMPRATE_100HZ);
    sensor.setHighresModeEnabled(true);
    }
Software
Acquisition
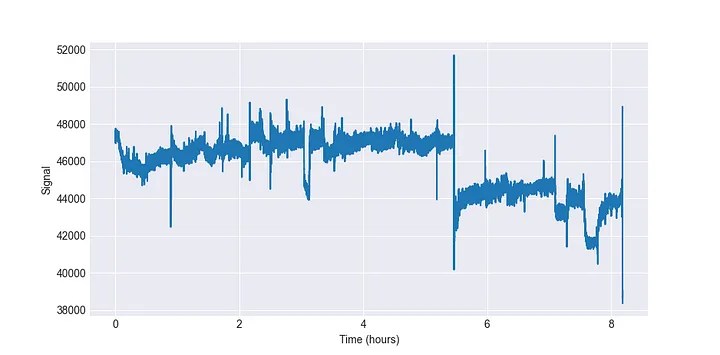
With the hardware now correctly configured, the next step is to log the RAW data for subsequent processing. To achieve this, we will employ a straightforward Python program. This program will establish a serial connection with the Gemma, retrieve RAW data from the sensor, append a timestamp to the data, and then save it to a CSV file for further analysis and utilization.
import serial
import time

name = time.strftime("%Y%m%d-%H%M%S")
timeout = time.time() + 60*5

with serial.Serial('/dev/ttyACM0', 115200, timeout=None) as ser:
    with open(name + ".txt", "w") as f:
        while True:
            f.write(str(time.time_ns()) + ", " + str(ser.readline(), 'ISO-8859-1'))

Analysis
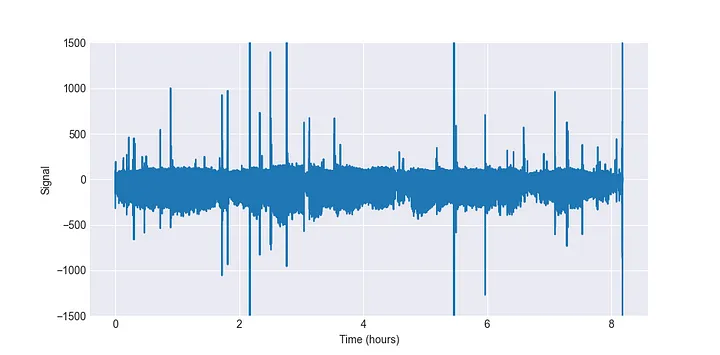
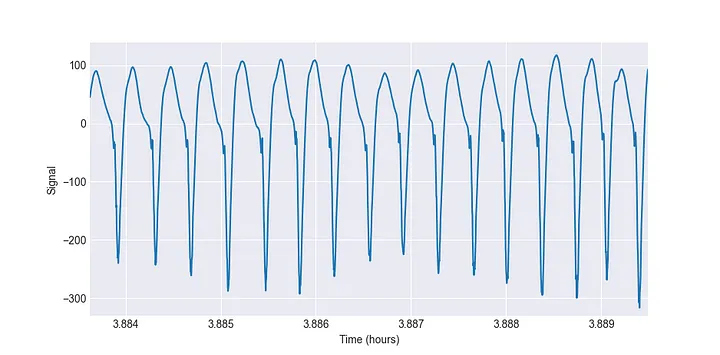
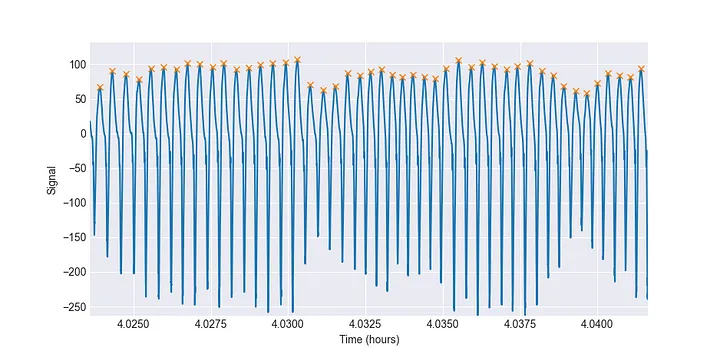
The data analysis process will closely resemble what we’ve discussed in previous posts. It involves using Pandas and SciPy for data loading and cleaning of the time series, and the HrvAnalysis package for computing HRV features. The data analysis is straightforward:
- A Wiener filter to remove noise.
- A high-pass filter to remove movement artifacts.
- Peak detection to determine RR intervals.
- RR intervals artifact and outlier removal using HrvAnalysis package.
Testing
Data
To evaluate the performance of this open-source continuous monitor, we conducted a test by recording data from a subject’s entire night of sleep using the setup and analysis methodology detailed earlier. The recorded data is divided into intervals of 3 minutes, from which we extract HRV parameters.

Result
Without delving too deeply into the intricacies of nocturnal data analysis, we observe that our recorded data aligns closely with previous recordings obtained, for instance, with devices like the Oura band. The trends show a decrease in heart rate (HR) and an increase in heart rate variability (HRV) indicators throughout the night, indicating a positive sign of recovery during sleep.
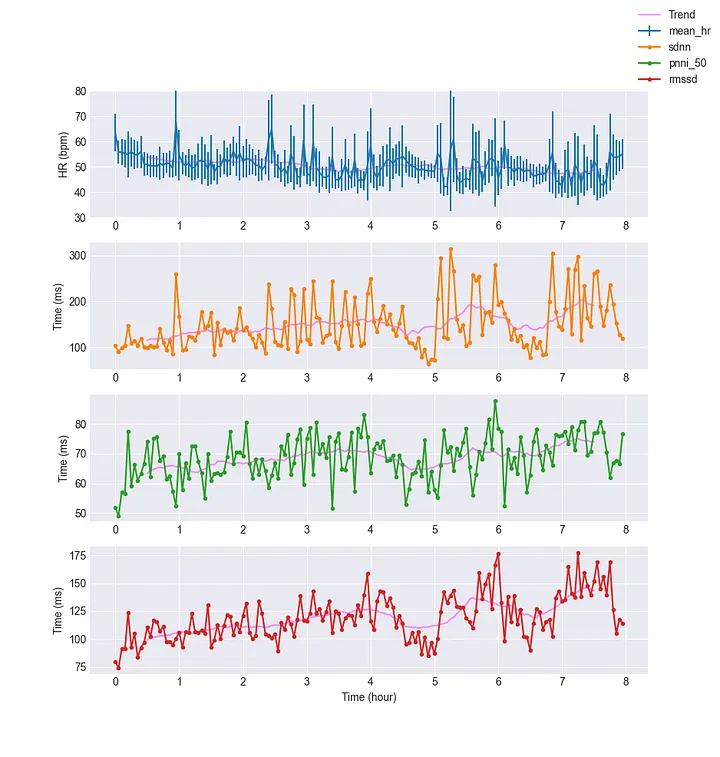
In the last minute of the recording, the following parameters were compared with measurements obtained using the smartphone application HRV4training:
- Mean HR: 54.37 vs. 53.5 for HRV4training (a difference of 1.626%).
- SDNN: 71.76 vs. 72.5 for HRV4training (a difference of 1.02%).
- rMSSD: 79.49 vs. 72 for HRV4training (a difference of 10.4%).
- pnn50: 65.00 vs. 45.5 for HRV4training (a difference of 42.9%).
Consideration
The PPG signal is recognized for its susceptibility to motion artifacts. In our dataset, it’s evident that motion triggers substantial mean shifts in the PPG signal, which can be rectified by applying pass-band filters. It’s imperative to conduct further tests to determine if other types of motion artifacts during sleep might affect the data. Remarkably, unnatural movements, such as periodic finger tapping, render the PPG signal less reliable. In upcoming posts, we will explore various motion artifacts and their impact on the data.
Conclusion
In this article, we introduced an open-source continuous heart rate monitoring device. We outlined the components and setup, including an Arduino sketch to collect raw data. The software section covered data acquisition and analysis. Testing showed promising results in line with commercial devices. We noted potential motion artifacts impacting data reliability, to be explored further. This affordable solution empowers users to monitor and analyze their heart rate data, democratizing access to valuable health insights.