Exploring ECG and PPG: MAX30100 and AD8232 Comparison
Introduction
This article aims to provide a comparison between the MAX30100 pulse oximeter and the AD8232 one-lead ECG device. In a prior post, we delved into the setup of the MAX30100 for recording a photoplethysmograph (PPG) signal at a frequency of 100 Hz. In this article, we will guide you through configuring the AD8232 to capture a one-lead electrocardiogram (ECG) signal at a rate of 400Hz. Additionally, we will perform a comparative analysis of the results, focusing on heart rate (HR) and heart rate variability (HRV) parameters obtained from these two devices.
ECG
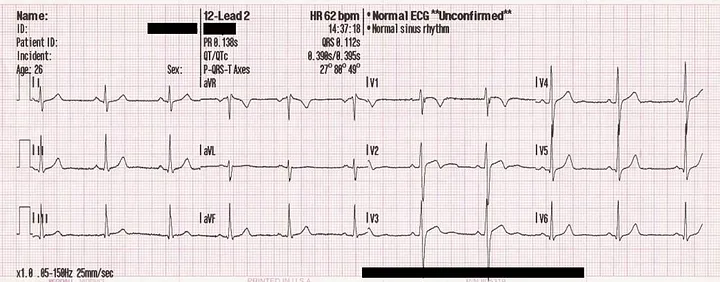
An electrocardiogram (ECG or EKG) is a graphical representation obtained by recording the electrical currents coursing through the heart during each cardiac contraction. ECGs are categorized into different types based on the number of recorded signals, known as leads, depending on the number of electrodes attached to the subject. The standard ECG conducted by cardiologists is the 12-lead ECG, which requires the placement of 10 electrodes. This 12-lead ECG proves most valuable for diagnostic purposes in pathology assessment. In contrast, long-term recordings or basic heart monitoring often employ the 1-lead ECG, requiring only two electrodes.
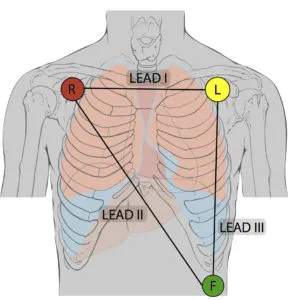
In our specific scenario, we utilize the AD8232 1-lead ECG, which uses three electrodes. It’s worth noting that, from a technical standpoint, each lead of the 12-lead ECG can be sequentially reproduced using a one-lead ECG by altering the electrode placement.
AD8232 setup
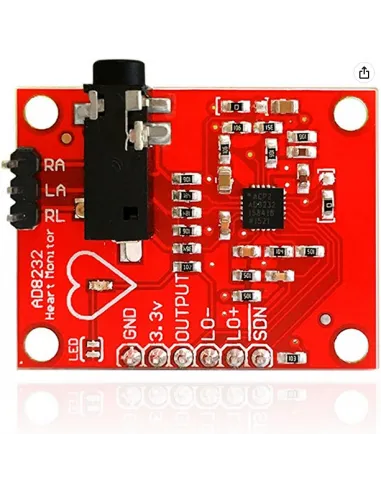
Setting up the AD8232 is a reasonably straightforward process, and you can do it by following the pinout connections:
- Connect GND to the ground (GND) pin.
- Attach 3.3V to the 3.3V power source.
- Link the OUTPUT to the analog pin A0.
- Optionally, you can connect LO- to pin 9.
- Optionally, connect LO+ to pin 8.
Subsequently, you can utilize an Arduino sketch to retrieve data from the A0 pin every 2.5 milliseconds, achieving an acquisition rate of 400 Hz. This data is then transmitted through the serial port. A Python script will read and store these values for further processing.
#define PERIOD 2500
unsigned long last_us = 0;

void setup() {
// initialize the serial communication:
Serial.begin(115200);
pinMode(8, INPUT); // Setup for leads off detection LO +
pinMode(9, INPUT); // Setup for leads off detection LO -

}

void loop() {

  if((digitalRead(8) == 1)||(digitalRead(9) == 1)){
    Serial.println('!');
  }
  else{
    if (micros () - last_us > PERIOD){
      Serial.println(analogRead(A0));
      last_us += PERIOD;
    }
  }
}
For ECG recording, we employ a 3-electrode bundle connector in conjunction with 48–50mm foam electrodes from Eurpecgelectrodes. These electrodes are positioned in accordance with the standard recommended placements. Throughout the recording process, the subject is seated in a relaxed and motionless position, ensuring the accuracy of the measurements.
PPG
The ECG results will be compared to a concurrently recorded PPG signal utilizing the MAX30100 setup, as explained in previous posts. As a reminder, the PPG signal, initially at 100 Hz, is resampled to 800 Hz and then detrended. To enhance the signal quality, a Wiener filter with a window of 31.25 ms is applied for noise reduction, followed by the application of a Savitzky-Golay (Savgol) filter with a 375 ms window to sharpen peaks and improve the detection of RR intervals.
ECG

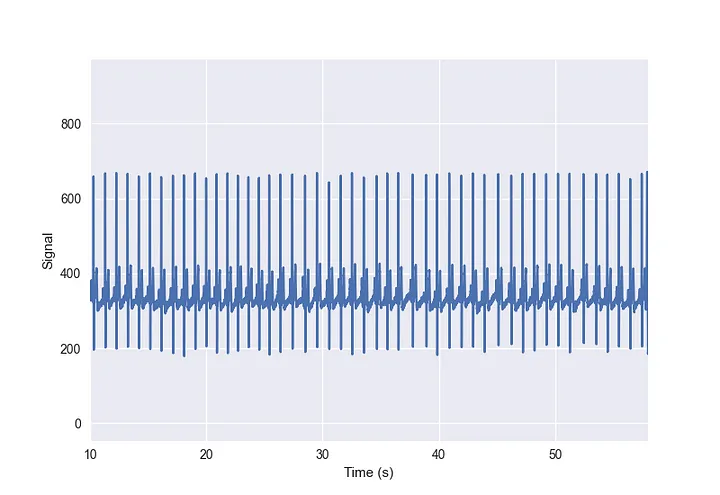
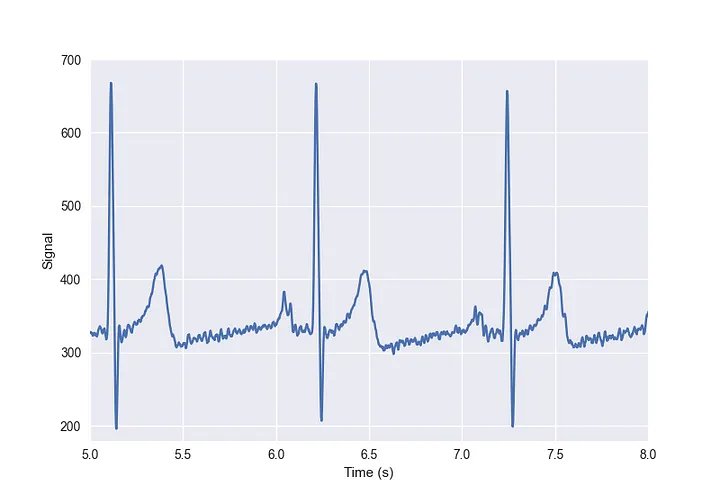
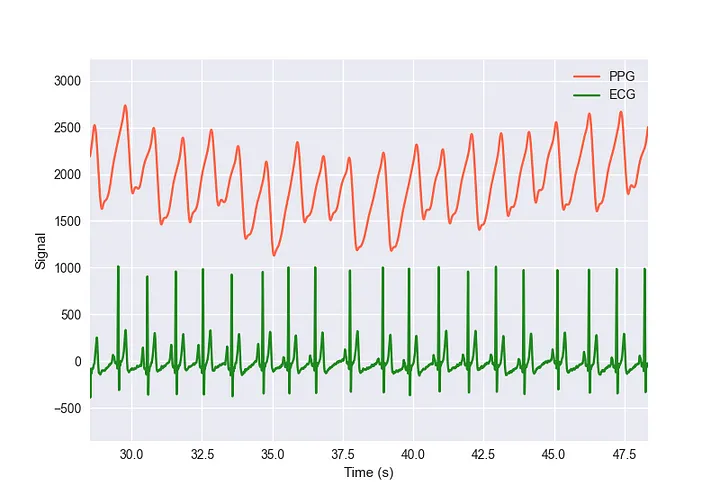
In Figures 1 and 2, we present the raw signals recorded with the AD8232. In these figures, we can distinctly observe the characteristic wave patterns of a standard ECG, including the QRS complex, as well as the P and T waves.
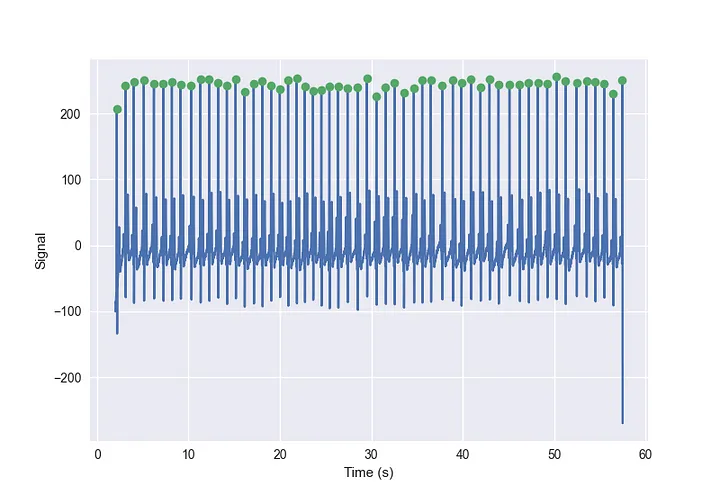
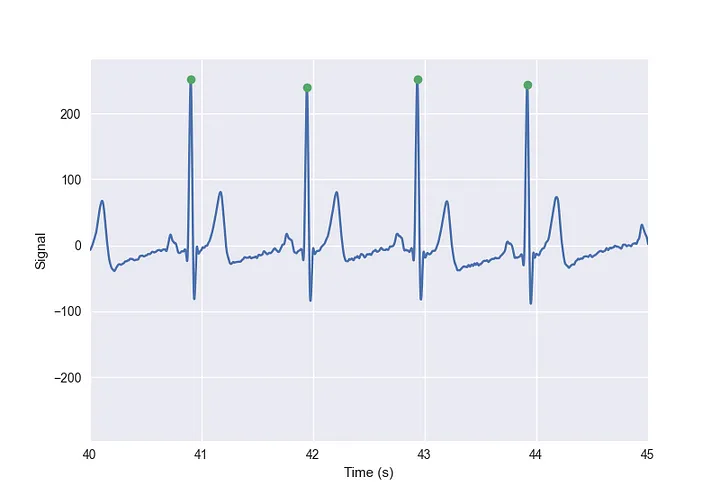
To enhance signal clarity, as depicted in Figure 3 and 4, we follow a series of signal processing steps. First, we resample the original 400 Hz signal to 800 Hz. Next, we detrend the signal and apply a Wiener filter with a window size of 6.25 ms, followed by a Savgol filter with a window size of 56.25 ms. Subsequently, we employ a simple peak detection method to identify and mark the R peaks within the signal.
Result
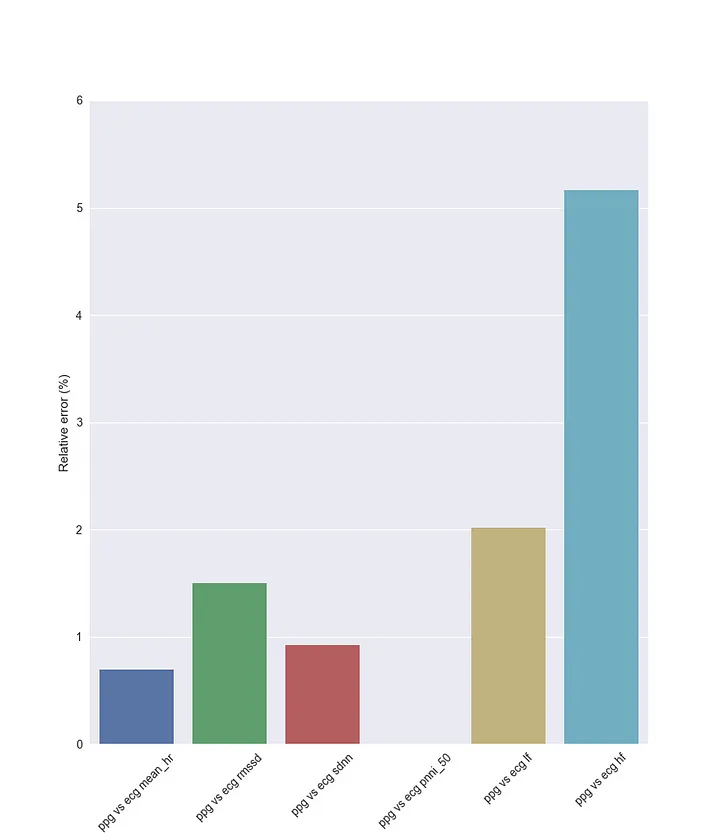
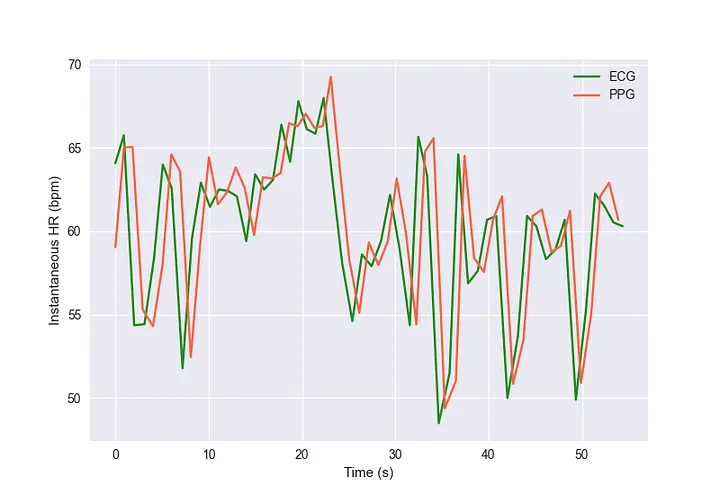
In Figure 3, we illustrate the relative error between the HR and HRV metrics computed using the ECG and PPG signals. It’s noteworthy that these metrics are in good agreement, as evidenced by the following comparisons for time domain analysis HRV parameters:
- mean_hr_ppg: 60.46 bpm vs. mean_hr_ecg: 60.05 bpm
- rmssd_ppg: 96.13 ms vs. rmssd_ecg: 97.60 ms
- sdnn_ppg: 82.11 ms vs. sdnn_ecg: 82.87 ms
- pnn_50_ppg: 48.15 ms vs. pnn_50_ecg: 48.15 ms
These closely aligned metrics indicate the consistency and reliability of the data obtained from PPG and ECG signals.
Conclusion
In conclusion, this article compared the MAX30100 pulse oximeter and the AD8232 1-lead ECG device for heart parameter monitoring. We detailed their setups, electrode placement, and signal processing methods. The results demonstrated a strong correlation between the heart rate and heart rate variability metrics obtained from both ECG and PPG signals, emphasizing the reliability of these monitoring methods. This article is valuable for those interested in heart monitoring using ECG and PPG devices.