Comparing HW-827 and MAX10100 Pulse Sensors: Signal Processing Insights
Introduction
This article will compare the HW-827 pulse sensor (green PPG) and the MAX10100 pulse oximeter (red and infrared PPG). Building upon our previous post, where we provided instructions on how to set up both the HW-827 and the MAX10100 using open-source hardware and software, we will now explore these devices in greater detail to help you better understand their features and functionalities.
Setup
We employed a dual Arduino setup to record heart rate (HR) activity to conduct a comparative analysis of these two sensors. Each sensor was carefully positioned on the test subject’s finger, and the resulting signals were meticulously recorded at 100 Hz through a Python script. Subsequently, we applied standard signal processing techniques, including a resampling to 500 Hz using quadratic interpolation, a Wiener filter to eliminate noise, the Savitzky-Golay algorithm to smoothen the signal, and a straightforward peak detection method to identify RR intervals.
Result
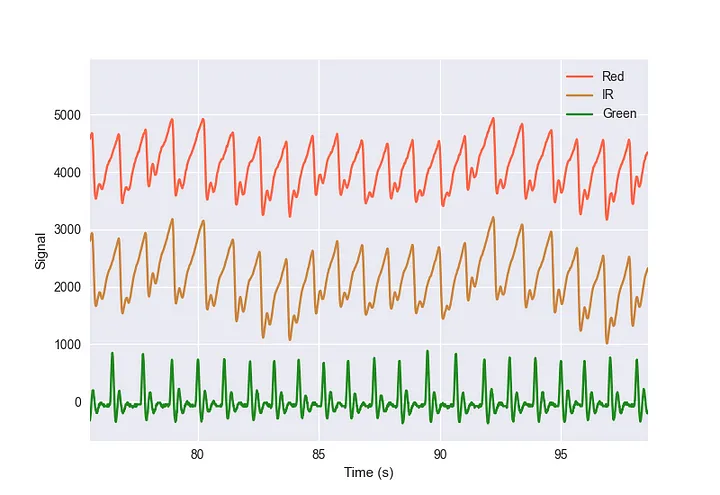
Figure 1 provides a visual representation of the signals generated by both sensors. Within this graphical depiction, we can readily discern the distinctions in waveform between the red, IR, and green PPG signals and the evident temporal desynchronization stemming from the placement of the two sensors (the vertical separation was manually achieved to enhance visibility).


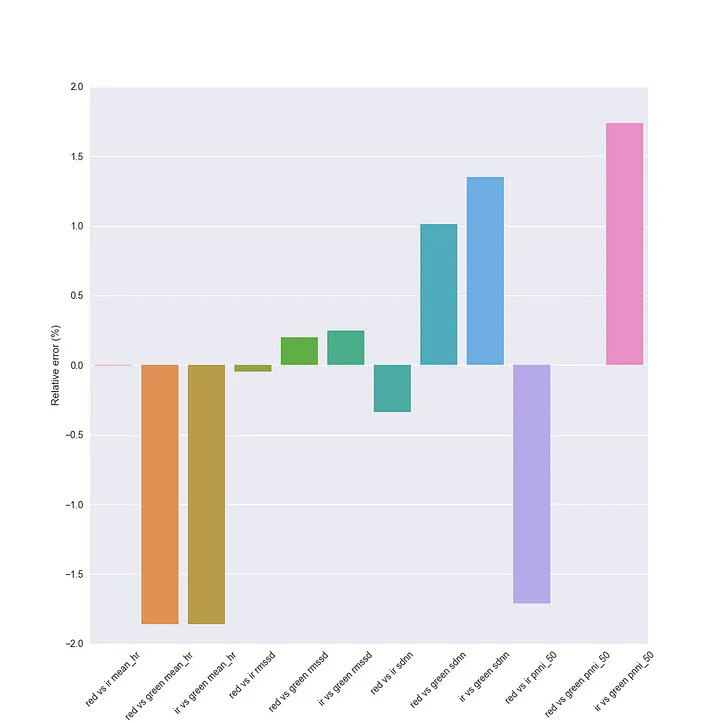
The second figure illustrates the relative errors between the computed HRV parameters derived from the three signals. All the parameters exhibit a relative error of less than 2%, indicating a high level of agreement between the sensors. As mentioned previously, the signal processing involves several crucial steps. Initially, we employ resampling to enhance the accuracy of peak detection, followed by noise removal and smoothing. To assess the impact of these processing steps on the numerical outcomes, we select random but coherent parameters for resampling, denoising, and smoothing. We then compute the peak positions to gauge how processing affects HRV parameters. This analysis is particularly vital when comparing data from various sensors. For internal comparisons, we opt for parameters that appear to detect the peak most accurately, ensuring reliability when comparing recordings from the same sensor.

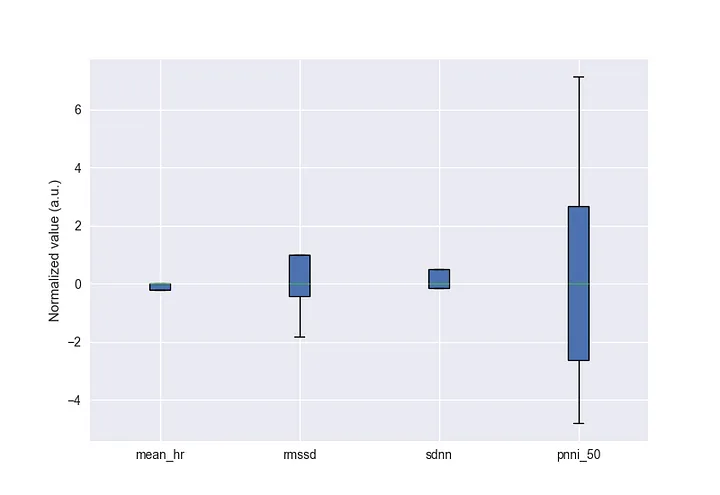
In the third figure, we observe that HRV parameters exhibit resilience to variations in these preprocessing parameters, as long as they are maintained within a range that allows each peak to be well-defined — sharp and characterized by relatively low noise. Notably, the most sensitive HRV metric appears to be the PNN50, which is unsurprising given its calculation from NN50, the number of pairs of successive NN intervals differing by more than 50 ms. This metric can be highly responsive to peak misalignment if excessive noise or smoothing is present.
It’s important to note that your two sensors operate at a 100 Hz sampling rate, resulting in peak detection discretization of approximately +/- 10 ms. In the case of the MAX10100, the peak width at 90% of amplitude is around 120 ms. Therefore, preprocessing can significantly impact NN50. To mitigate this effect, we resample the data to 500 Hz, thereby enhancing peak detection accuracy.
It’s essential to contextualize these values in relation to the daily fluctuations in HRV metrics. For instance, the magnitude of change between a “bad” and “good” day can exceed 50 ms for SDNN and rMSSD and surpass 40% for PNN50. This underscores the possibility of being able to compare these values, even when changing sensors or employing a new analysis pipeline without recomputing previous data.
Conclusion
In summary, we conducted a quick comparison between the HW-827 pulse sensor (green PPG) and the MAX10100 pulse oximeter (red and infrared PPG). Surprisingly, our setup, signal processing, and analysis revealed a strong level of agreement between these sensors, even after substantial signal preprocessing was required for the HW-827. We emphasized the importance of maintaining peak detection precision, which led to data resampling for accuracy and the use of Wiener and Savitzky-Golay techniques to remove noise. Notably, we demonstrated the robustness of HRV metrics to signal preprocessing, highlighting the potential for consistent comparisons even when changing sensors or analysis pipelines.