Unlocking HRV Insights: Smartphone-Based PPG Signal Analysis
Introduction
In the two previous articles, we explored the process of recording heart rate from a Photoplethysmography (PPG) signal using a basic smartphone and delved into the computation of heart rate variability (HRV) from clean ECG data. Now, let’s embark on a journey to combine these two approaches and ascertain if we can precisely calculate HRV metrics with the help of a simple smartphone.
PPG Signal
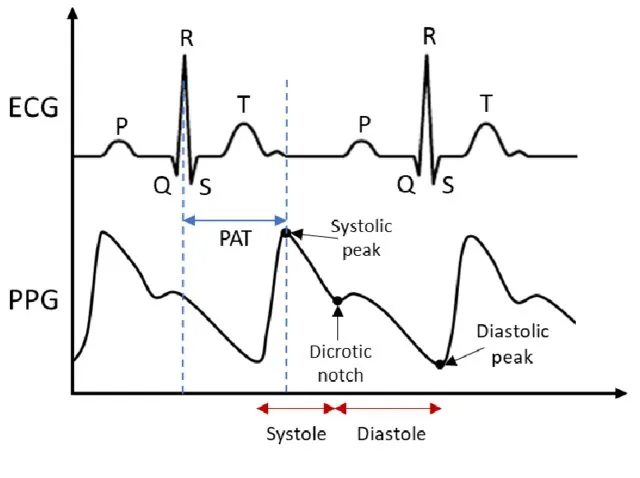
In the previous article, we simplified the analysis of the PPG signal by filtering out frequencies that were either too small or too large. We then applied a straightforward Fast Fourier Transform (FFT) to identify the dominant frequency, which we used to approximate the average heart rate. This method offers the advantage of reducing bias caused by signal quality issues. Now, let’s dive deeper into the intricacies of the PPG signal. First, we notice that the characteristic QRS complex found in ECG signals is notably absent. Instead, we observe a prominent peak known as the systolic peak, followed by a smaller peak known as the dicrotic notch. This waveform is commonly referred to as a cardiac wave. To calculate HRV metrics, we typically identify the R peaks of the QRS complex in ECG signals. In the case of the PPG signal, our focus shifts to detecting these systolic peaks as key reference points.
Analysis
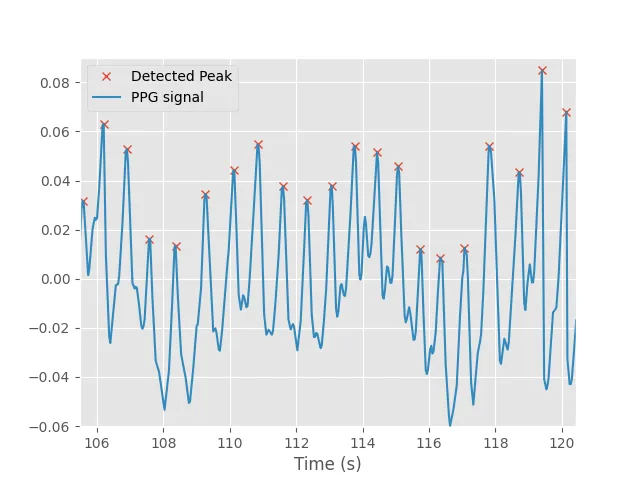
As is our customary practice, we will utilize the mean value of the green channel for each image in our analysis. This signal is subjected to detrending, and we employ a Wiener filter to effectively eliminate any noise interference. Subsequently, we proceed to identify the peaks of each cardiac wave and calculate the time intervals between successive waves, thereby generating a representation akin to RR-intervals.
These RR-intervals are then subjected to further refinement by excluding any intervals that deviate from the mean value of the series by more than 3 standard deviations. With this refined dataset, we can proceed to apply the time and frequency analysis methods outlined in detail in the following resource: https://medium.com/@bgallois/introduction-to-heart-rate-variability-hrv-analysis-1d181d026c32.
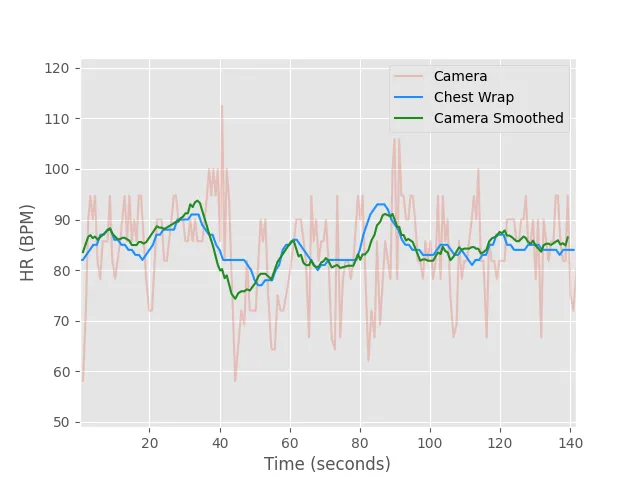
Initially, we calculated both the instantaneous heart rate and the mean heart rate, subsequently comparing them to the measurements from the chest strap for validation purposes. The heart rate recorded by the chest strap device yielded a value of 84.57 ± 3.25 BPM, while the heart rate deduced from the PPG data resulted in 84.72 ± 9.24 BPM.
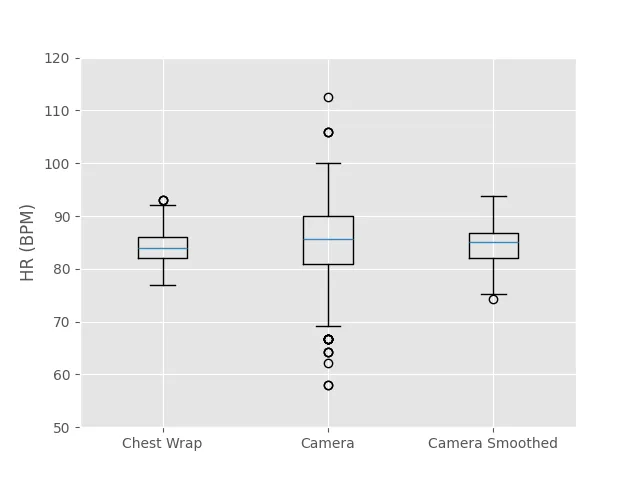
The instantaneous heart rate, when computed using the common definition based on RR intervals, may exhibit some level of noise. To mitigate this, we applied a rolling mean with a 500 ms window to the instantaneous heart rate, yielding a more stable value of 84.67 ± 3.79 BPM. Encouragingly, these values appear to be in good agreement.
Next, we proceed to calculate the standard HRV metrics:
- SDNN: 85.06 ms
- pNN50: 43.00%
- RMSSD: 89.79 ms
It’s worth noting that we lack a direct comparison for these values, since the chest strap device does not provide RR-intervals or raw ECG data. However, we do have information that the test subject regularly records its HRV metrics, and our computed values fall within the range of its daily measurements. This alignment suggests that our HRV metrics are consistent with the subject’s typical data, lending some credibility to this approach.
Conclusion
In summary, our exploration of combining PPG signal analysis and HRV computation using a smartphone has shown promising results. We simplified PPG signal analysis, focusing on systolic peaks as key markers. Our analysis involved using the mean value of the green channel, which was processed to calculate RR-intervals and subsequently refined to exclude outliers. When compared to measurements from a chest strap device, our calculated heart rates demonstrated close alignment, affirming our method’s reliability. We also computed standard HRV metrics — SDNN, pNN50, and RMSSD. While we lacked a direct comparison, our results fell within the range of daily measurements from the test subject, indicating consistency.